US Automotive Recalls, 1966-2022
Trend analysis in a recently released NHTSA dataset detailing US auto recalls shows that recalls have steadily increased since 1966.
Michael Nolan
0. Introduction: NHTSA and Vehicle Recalls
The National Highway Traffic and Safety Administration, founded in 1968 after a series of US vehicle safety regulations were passed in the mid 1960s, is responsible for managing recalls from both domestic and international vehicle manufacturers. According to the NHTSA website, recalls are issued “when a manufacturer or NHTSA determines that a vehicle, equipment, car seat, or tire creates an unreasonable safety risk or fails to meet minimum safety standards.” When the administration issues a recall, “manufacturers are required to fix the problem by repairing it, replacing it, offering a refund, or in rare cases repurchasing the vehicle.”
While vehicle recalls in the US date back to the beginning of the 20th century, it was in 1966 that the federal government began keeping records of all recalls through the NHTSA. The administration recently published these recall records as a public dataset containing all recalls it has issued from 1966 though 2023.
The data show a substantial increase in the number of recalls issued each year since 1966. The number of customers affected by these recalls has also increased over time, but the number of customers affected by recalls from any given manufacturer has remained mostly constant since 1966. The data also show an increase in the number of manufacturers issuing recalls each year.
1. More and More Recalls are Issued Every Year
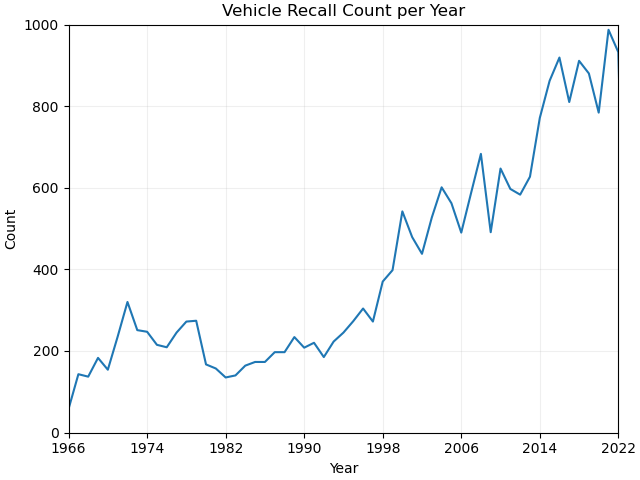
The number of recalls issued from all manufacturers in a given year has risen steadily from 1966 to 2022 from less than 100 recalls per year to greater than 900 recalls per year. A similar trend is seen in the total number of customers affected by vehicle recalls each year, with fewer than one million drivers affected in 1966 growing to a peak of over fifty million drivers in 2016.
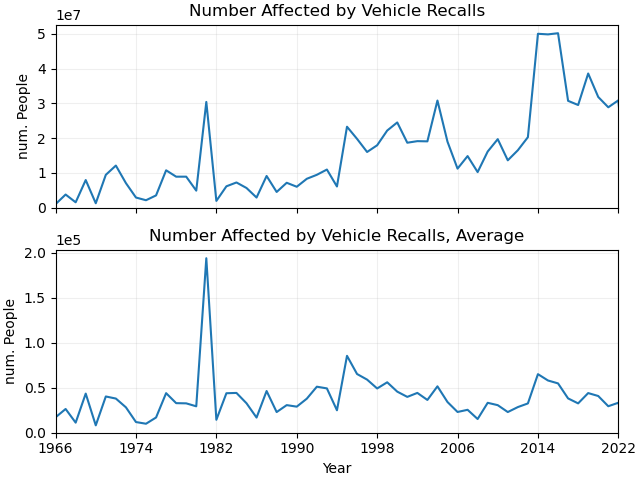
It makes sense that these trends correlate: more recalls, more people affected by those recalls. Normalizing the number of affected customers by the number of recalls each year, we see a pretty flat trend floating between 20 and 50 thousand people per recall per year.
A clear exception is the massive spike in affected persons in 1981. This can be accounted for by a single recall of several decades-worth of vehicles produced by Ford Motor Company (including cars and trucks from the Ford, Lincoln and Mercury brands) in January of that year. Turns out those cars’ automatic transmissions had a nasty habit of popping from Park into Reverse. This, understandably, upset a few people. The defect was blamed for over 6000 driving accidents injuring 1700 people and killing 98. While this issue resulted in Ford being sued several times over for damages and loss of life, the 1981 recall only amounted in Ford sending out warning label stickers to those affected. The stickers reminded drivers to “(1) Make sure the gear selector lever is engaged in Park. (2) Set the parking brake fully. (3) Shut off the ignition.” Great work!
2. Who gets recalled the most?
The scale of the 1981 recall may nudge one to ask which manufacturers’ vehicles were recalled the most. The bar chart shown below plots the total number of recalls from the top twenty recalled manufacturers over the 56 year span of the dataset.
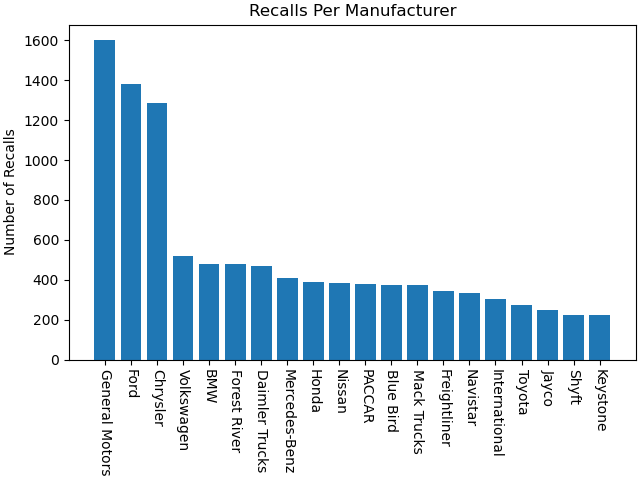
The top companies here are probably pretty familiar to US drivers: GM, Ford and Chrysler (now a brand owned by the Stellantis group). A similar list appears in the distribution of drivers affected by recalls over the same period:
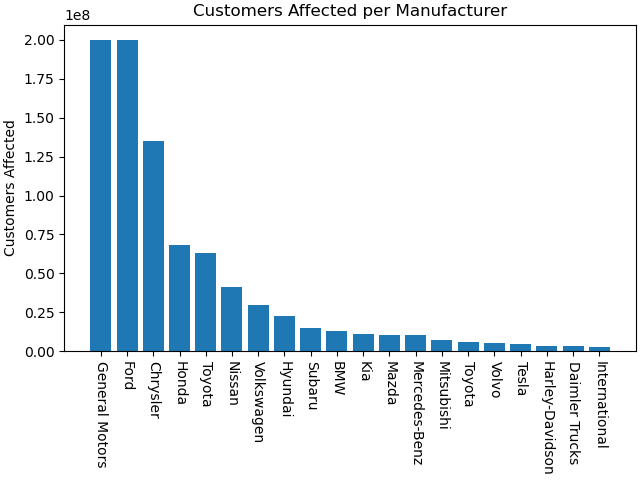
Again, the same companies are the worst offenders: GM, Ford, Chrysler. Seeing the 1981 spike in customers affected for all manufacturers being so highly influenced by Ford alone, I thought it would be worthwhile to look at trends across time for these top three recalled manufacturers:
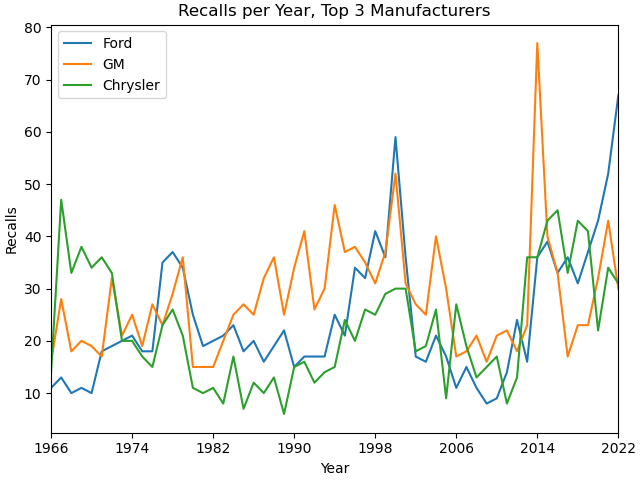
While the correlations between these three aren’t - by inspection - all that tight, one can see a few ebbs and flows in these yearly recall rates over the past 56 years. All three spiked in the late 90’s and early 2000’s, all three have increased substantially in the past 10 years, and all three saw a slight bump in recalls in the three year period between ‘77 and ‘80.
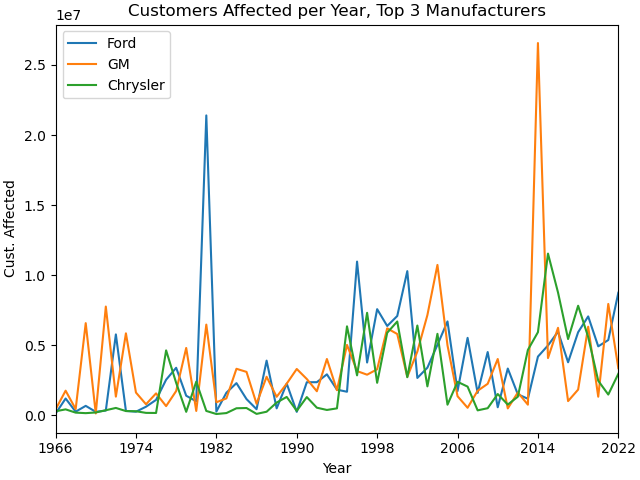
Plotting customers affected per year over the same period for these top 3 manufacturers shows a relatively low boil in total affected persons count until the mid 90’s, save for the aforementioned spike for Ford in 1981. A slight bump in the late 90’s dies off by the mid 2010’s before slowly starting to increase up until the present day.
Similar to the 1981 spike is the 2014 spike in total drivers affected from GM recalls. While this spike is larger than the one seen from Ford in 1981, this count is accumulated over 77 different recall events seen from GM in that year.
3. More manufacturers are recalling vehicles
Despite these three companies accounting for over 40% of all vehicle recalls since 1966 and over 62% of the total number of recall-affected customers over the same period, these plots don’t show the same clear increasing trends over time seen when plotting the same rates aggregated over all manufacturers (i.e. the first two plots in this article). If these companies are driving this growth, what is?
One hypothesis is that more manufacturers are submitting recalls over time. To check this idea I’ve plotted the number of different manufacturers recalling at least one vehicle per year.
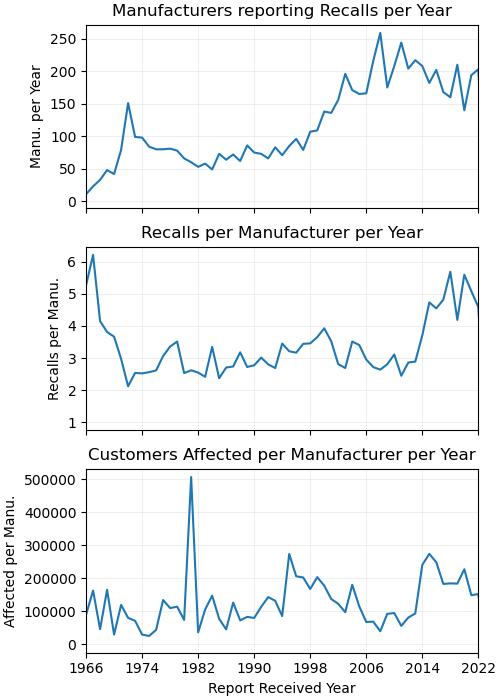
In this plot we see a ~10x increase in the count of recalled manufacturers that matches the pattern of increased recalls over time. This paired with the overall flat rate of recalls per year from the most recalled manufacturers implies that the growth in overall recalls per year is primarily driven by more manufacturers being forced to recall their vehicles. Normalizing the number of recalls each year by the number of manufacturers recalling vehicles in each year, we see a mostly flat trend apart from a rapid decrease in the late 60’s and a notable bump starting in 2014. Affected drivers per year normalized by recalling manufacturers also shows a flat trend with a notable spike in affected customers seen in 1981, again attributable almost entirely to the Ford recall of that year.
Summary
This dataset documents all recalls issued in the US by the NHTSA since its creation in 1966. While it details all recalls of vehicles, equipment, car seats and tires, I’ve chosen to focus on vehicle recall trends in this report. The vast majority of recalls in this dataset were of vehicles, as seen in the table below:
| Recall Type | Count |
|---|---|
| Vehicle | 23090 |
| Equipment | 2525 |
| Tire | 744 |
| Child Seat | 231 |
While the number of recalls per year has increased nearly 10x over the past half-century, and the number of customers affected by these recalls has grown nearly 50x over the same period, the number of recalls slapped on each individual manufacturer has not changed substantially. The recall rate increase can be partially accounted for by increasing number of manufacturers recalling vehicles each year, but it’s unclear why this is the case. Furthermore, all of these analyses are entirely by inspection and could stand more thorough statistical analyses.